The Air Monitoring Stations are operated in compliance with Alberta's Air Monitoring Directive (AMD). All data goes through a rigorous quality assurance and quality control program, including daily equipment checks, monthly multipoint calibrations, and annual government audits conducted by Alberta Environment and Protected Areas. PAZA also conducts frequent data reviews for variances and trends.
The data is compared against Alberta Ambient Air Quality Objectives (AAAQOs) and Guidelines (AAAQGs) as defined in the Alberta Environment Protection and Enhancement Act(EPEA).
The AAAQOs are established to provide protection of the environment and human health. PAZA reports any exceedances of AAAQOs and submits monthly and annual air quality monitoring reports to Alberta Environment and Protected Areas.
The AAAQGs are used as indicators for some types of odours as well as for air quality management and planning. This includes assessment of local air quality concerns and indicators of ambient air quality.
PAZA also provides near instantaneous air quality data for public viewing online. For the calculation of the Air Quality Health Index (AQHI) measurements, PAZA submits up to the hour data to Alberta Environment and Protected Areas. The AQHI is updated hourly, 24-hours-a-day, and can be viewed on our website and the Government of Canada website.
All of PAZA’s data goes through rigorous daily and monthly checks. This ensures that everyone can rely on the quality of data the PAZA provides.
Daily:
Automatic Zero/Span: Analyzer self-tests measure the baseline level, allowing for correction of any bias in the data due to a non-zero baseline. The analyzer then tests at a known, high concentration (“span”) to verify that the analyzer responds to the introduction of the compound of interest and that it responds as expected.
Technician review: A technician reviews the previous 72 hours of data daily to verify regular operation of the station, and will trigger action if required.
Monthly:
Calibration: Stations are attended once every calendar month, at a minimum, to check normal operation and conditions, as well as to calibrate instrumentation. Instruments are “challenged” with known concentrations of gases, and the outcome of these tests is used to correct the raw data if required.
Quality Assurance/Quality Control and Reporting: A Data analyst reviews the previous month of data for invalid data. They will apply baseline corrections suggested by the daily zero/spans, as well as adjustments due to monthly calibrations as needed. Data reports are generated, and the data is submitted to the Airdata Warehouse, where another review is conducted by automated systems before acceptance.
Yearly:
Audit: An auditor from Alberta Environment and Protected Areas attends each station with PAZA’s technician to independently verify that the station and analyzers are being operated in conformance with the Alberta Air Monitoring Directive (AMD).
Air quality can be impacted by many sources both through human activity and natural phenomenon.
- Point Sources: factories, industry, power plants, home and business heating and cooling
- Mobile Sources: transportation - personal and commercial vehicles, recreational vehicles, watercraft, aircraft, agricultural and personal use tractors/equipment, and more…
- Natural Sources: trees, vegetation, wetlands, gas seeps, forest fires
- Area Sources: small sources, BBQs, firepits, drycleaners, pesticide use
In addition to wind speed and direction, other important meteorological parameters affect the transport and dispersion of air monitoring at the stations. Monitoring at the stations depends on what is expected in the area and the available technology. For example, monitoring stations in urban centres typically measure for Nitrogen Oxides (NOx), Carbon Monoxide (CO), Fine Particulate Matter (PM2.5), and Ozone(O3). These parameters are commonly associated with vehicle emissions, and home heating and cooling.
In an industrial area, PAZA may monitor Sulphur Dioxide (SO2), Total Reduced Sulphur (TRS), Hydrogen Sulphide (H2S), Total Hydrocarbons (THC), Methane (CH4), Non-Methane Hydrocarbons or Fine Particulate Matter (PM2.5), depending on the industry or activity in that area.
In rural areas, PAZA may monitor for Fine Particulate Matter (PM2.5), Ozone(O3), or Nitrogen Oxides (NOx).
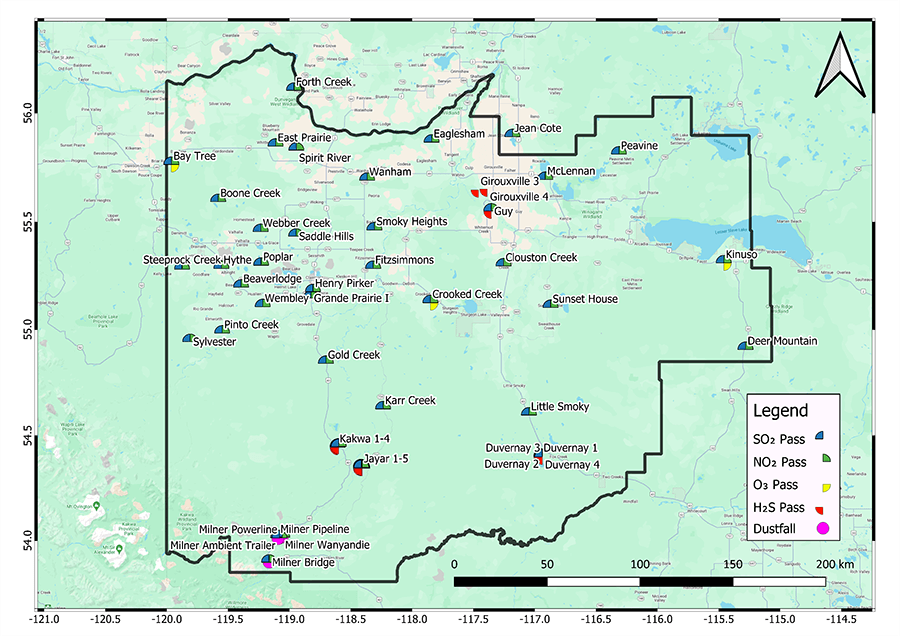
Passively monitored parameters:
- Sulphur dioxide
- Nitrogen dioxide
- Ozone
- Hydrogen sulphide
Continuously monitored parameters:
- Sulphur dioxide (SO2)
- Total reduced sulphur (TRS)
- Hydrogen sulphide (H2S)
- Oxides of nitrogen (NO2, NO and NOX)
- Carbon monoxide (CO)
- Total hydrocarbons (THC)
- Methane (MHC)
- Non-Methane (NmHC)
- Ozone (O3)
- Fine particulate matter (PM2.5)
Meteorological parameters (that affect the transportation and dispersion of compounds):
- Wind speed and direction
- Solar Radiation
- Outdoor Temperature
- Relative Humidity
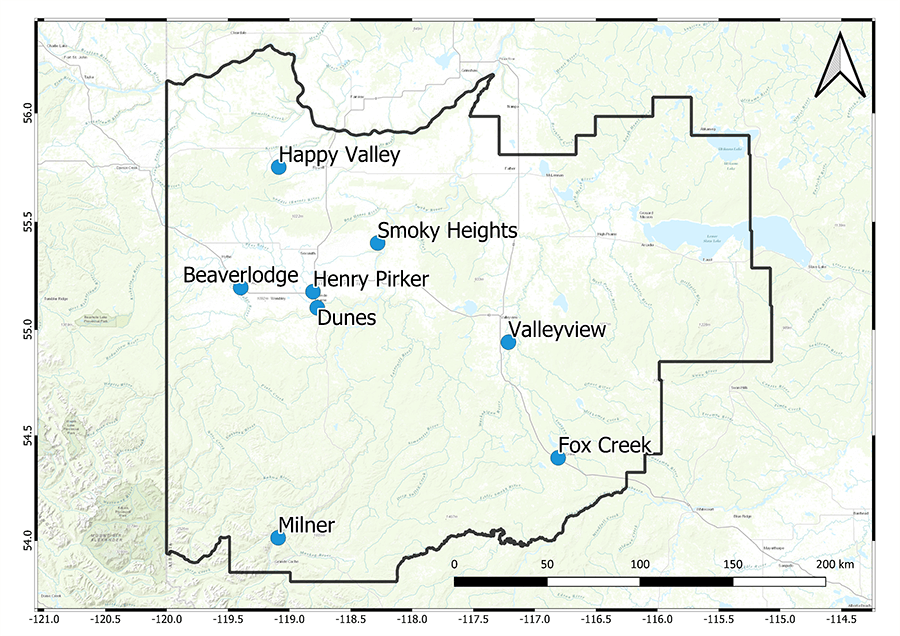
In addition, the Grande Prairie Henry Pirker, and Beaverlodge stations are part of the National Air Pollution Surveillance Program (NAPS), which monitors and assesses the quality of outdoor air in populated regions of Canada.