Air Quality Data – Date Range
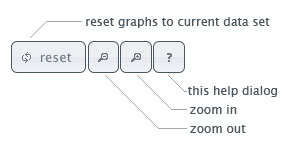
Buttons
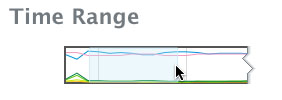
Viewing a selected range
To view a specific range of data within the specified date and time click a point and drag a selection in the Time Range graph. This will update all 3 graphs to show only the selected data. Select a new range or click reset to see the full data set.
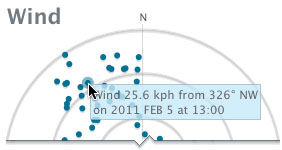
Data point information
To view information on a data point, or bar, hover the cursor over the point and an information window will pop–up to display the parameter name, value, units and sample time.
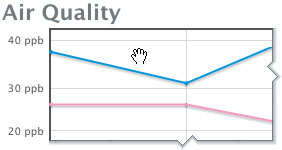
Panning
When a graph is zoomed in, either by selecting a range or by pressing the Zoom in (+) button, the data set can be adjusted by clicking and draging the graph. Only the Air Quality and Weather graphs can be manipulated in this manner. Adjusting the dataset in this way will cause the selected graph to be out–of–sync with the other graphs. To re–sync the graphs either select a new range in the Time Frame graph or press the reset button.
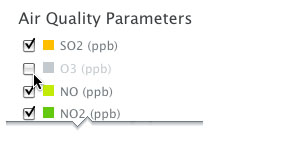
Selecting Parameters
To hide, or remove from the graph, any parameter click the checkbox. Hidden parameters, unchecked and grayed out, can be turn on or added to the graph by clicking the empty box next to the parameter name. Only parameters available at each station will be shown.
Donnelly Station
The raw data on this site has not passed through a process of baseline adjustment or validation.
| H2Sppb | SO2ppb | TEMP°C | StnTppb | WSkph | WD° | Mnf_Flwppb | StnPwrppb | |
|---|---|---|---|---|---|---|---|---|
| 2026-01-19 11:00 | --- | --- | --- | --- | --- | --- | --- | --- |
| 2026-01-19 10:00 | --- | --- | --- | --- | --- | --- | --- | --- |
| 2026-01-19 09:00 | --- | --- | --- | --- | --- | --- | --- | --- |
| 2026-01-19 08:00 | --- | --- | --- | --- | --- | --- | --- | --- |
| 2026-01-19 07:00 | --- | --- | --- | --- | --- | --- | --- | --- |
| 2026-01-19 06:00 | --- | --- | --- | --- | --- | --- | --- | --- |
| 2026-01-19 05:00 | --- | --- | --- | --- | --- | --- | --- | --- |
| 2026-01-19 04:00 | --- | --- | --- | --- | --- | --- | --- | --- |
| 2026-01-19 03:00 | --- | --- | --- | --- | --- | --- | --- | --- |
| 2026-01-19 02:00 | --- | --- | --- | --- | --- | --- | --- | --- |
| 2026-01-19 01:00 | --- | --- | --- | --- | --- | --- | --- | --- |
| 2026-01-19 00:00 | --- | --- | --- | --- | --- | --- | --- | --- |
| 2026-01-18 23:00 | --- | --- | --- | --- | --- | --- | --- | --- |
| 2026-01-18 22:00 | --- | --- | --- | --- | --- | --- | --- | --- |
| 2026-01-18 21:00 | --- | --- | --- | --- | --- | --- | --- | --- |
| 2026-01-18 20:00 | --- | --- | --- | --- | --- | --- | --- | --- |
| 2026-01-18 19:00 | --- | --- | --- | --- | --- | --- | --- | --- |
| 2026-01-18 18:00 | --- | --- | --- | --- | --- | --- | --- | --- |
| 2026-01-18 17:00 | --- | --- | --- | --- | --- | --- | --- | --- |
| 2026-01-18 16:00 | --- | --- | --- | --- | --- | --- | --- | --- |
| 2026-01-18 15:00 | --- | --- | --- | --- | --- | --- | --- | --- |
| 2026-01-18 14:00 | --- | --- | --- | --- | --- | --- | --- | --- |
| 2026-01-18 13:00 | --- | --- | --- | --- | --- | --- | --- | --- |
| 2026-01-18 12:00 | --- | --- | --- | --- | --- | --- | --- | --- |
| 2026-01-18 11:00 | --- | --- | --- | --- | --- | --- | --- | --- |
| 2026-01-18 10:00 | --- | --- | --- | --- | --- | --- | --- | --- |
| 2026-01-18 09:00 | --- | --- | --- | --- | --- | --- | --- | --- |
| 2026-01-18 08:00 | --- | --- | --- | --- | --- | --- | --- | --- |
| 2026-01-18 07:00 | --- | --- | --- | --- | --- | --- | --- | --- |
| 2026-01-18 06:00 | --- | --- | --- | --- | --- | --- | --- | --- |
| 2026-01-18 05:00 | --- | --- | --- | --- | --- | --- | --- | --- |
| 2026-01-18 04:00 | --- | --- | --- | --- | --- | --- | --- | --- |
| 2026-01-18 03:00 | --- | --- | --- | --- | --- | --- | --- | --- |
| 2026-01-18 02:00 | --- | --- | --- | --- | --- | --- | --- | --- |
| 2026-01-18 01:00 | --- | --- | --- | --- | --- | --- | --- | --- |
| 2026-01-18 00:00 | --- | --- | --- | --- | --- | --- | --- | --- |
| 2026-01-17 23:00 | --- | --- | --- | --- | --- | --- | --- | --- |
| 2026-01-17 22:00 | --- | --- | --- | --- | --- | --- | --- | --- |
| 2026-01-17 21:00 | --- | --- | --- | --- | --- | --- | --- | --- |
| 2026-01-17 20:00 | --- | --- | --- | --- | --- | --- | --- | --- |
| 2026-01-17 19:00 | --- | --- | --- | --- | --- | --- | --- | --- |
| 2026-01-17 18:00 | --- | --- | --- | --- | --- | --- | --- | --- |
| 2026-01-17 17:00 | --- | --- | --- | --- | --- | --- | --- | --- |
| 2026-01-17 16:00 | --- | --- | --- | --- | --- | --- | --- | --- |
| 2026-01-17 15:00 | --- | --- | --- | --- | --- | --- | --- | --- |
| 2026-01-17 14:00 | --- | --- | --- | --- | --- | --- | --- | --- |
| 2026-01-17 13:00 | --- | --- | --- | --- | --- | --- | --- | --- |
| 2026-01-17 12:00 | --- | --- | --- | --- | --- | --- | --- | --- |
| 2026-01-17 11:00 | --- | --- | --- | --- | --- | --- | --- | --- |
| Maxium Values | --- | --- | --- | --- | --- | --- | --- | --- |
| 1 hour guideline | 10 | 172 |
The raw data on this site has not passed through a process of baseline adjustment or validation.